IoT SIM for Power Distribution Area Monitoring: Remote Terminal Management, Anomaly Detection and Field Operations
Por jietion, Desarrollo de Negocio (BD) en Quanqiu IoT · Publicado
Definition: In distribution-area monitoring, IoT SIMs connect transformer, switchgear, cable and feeder sensing terminals and their edge gateways to the utility’s master station, so equipment condition and terminal health can be watched and managed remotely.
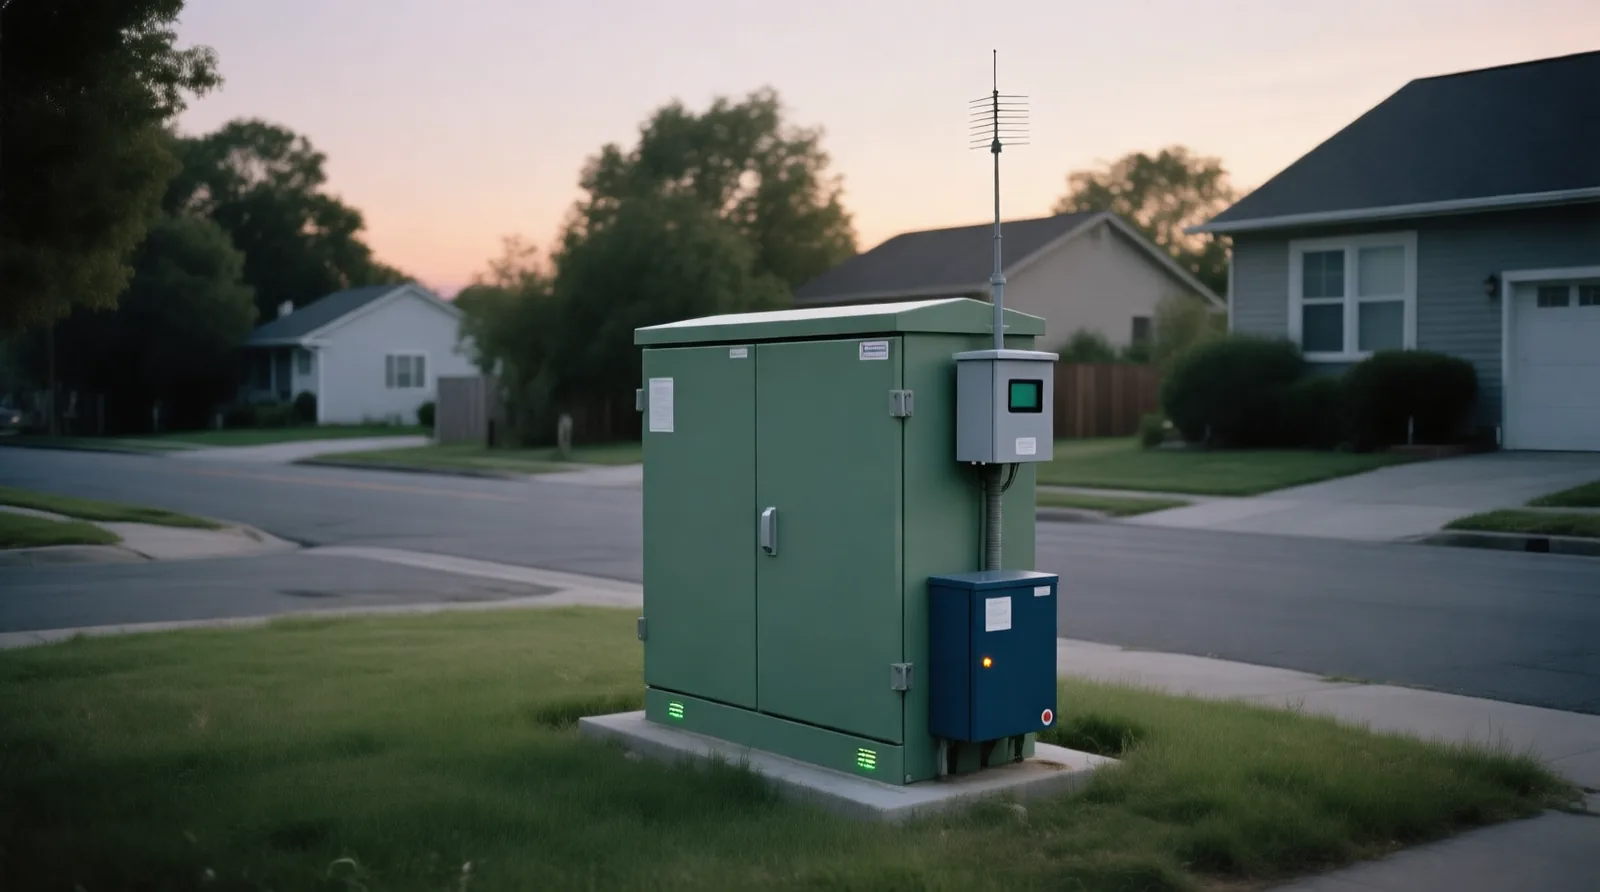
Distribution networks are where utilities have the most equipment and the least visibility. Feeders, low-voltage transformer areas and collector lines are spread over hundreds of square kilometres, and much of the equipment is still checked by crews on scheduled rounds. Recent studies from Chinese utilities show what happens when those assets are instrumented: hidden faults surface earlier, more problems are closed without a site visit, and maintenance shifts from fixed schedules to condition-based work. They also show that the connectivity design, meaning what is sent, when, and what happens when the link drops, decides whether those gains hold at scale.
Why distribution areas are hard to watch
A study of county-level distribution networks describes the scale: on average 11.7 monitoring points per square kilometre, more than 2,300 transformers per county and up to 680 km of 10 kV cable (Cen, 2026). Every one of those devices that fails silently eventually means a truck roll. With monthly manual rounds, one crew checks about 19 devices a day, each device gets under 72 hours of effective monitoring a year, faults are discovered 4.6 hours late on average, only 31.2% of hidden faults are caught early, and repair dispatch takes 127 minutes; inspection and repair labour make up 63.5% of maintenance spending, and legacy wired monitoring covers only 56.9% of points (Cen, 2026).
The problem is not only missing sensors. Monitoring terminals themselves fail quietly: when an acquisition or analog-to-digital module drifts, its readings shift only slightly and stay inside limits, so the fault hides in normal-looking data (Chen & Shen, 2026). The European Commission estimates that about EUR 584 billion of electricity infrastructure investment is needed between 2020 and 2030, much of it in distribution grids, and digital monitoring is one of the main ways utilities expect to get more out of existing assets. That makes the communication layer for these terminals a long-term procurement decision, not a pilot detail.
What a working architecture looks like
The designs in these studies converge on a layered model: sensing terminals, an edge or concentrator layer, and a master station or cloud platform. In one regional grid company with 208 substations and more than 14,600 equipment units, about 42,000 sensor nodes were deployed, and each station’s edge gateway compresses raw sampling to one upload per minute and can keep raising local alarms on its own for 72 hours if communication is lost (Liu, 2026). Transmission combined a fibre backbone, 5G as backup, LoRaWAN for endpoints and satellite links for emergencies, each protected by TLS 1.3 tunnels. After commissioning, warning response fell from 4.6 hours to under 800 ms and planned maintenance rose from 43% to over 75% (Liu, 2026).
At the transformer-area level, a three-area pilot placed 52 to 68 monitoring points per area, polled sensors every five seconds, captured partial-discharge events with one-minute records around each event, and kept a 48-hour circular cache in the concentrator so data could be resent after an outage (Tao, 2026). Coverage rose from around 70% to above 95% in residential, industrial and commercial areas, and false alarms fell to about 3% (Tao, 2026). Remote commands followed a master-station to concentrator to terminal chain with confirmation, up to three automatic retries and then a manual work order, with a full-link delay of one to two seconds (Tao, 2026). For substation-side protocol choices see our guides on IEC 61850 substation gateways and IEC 60870-5-104 telecontrol RTUs.
Event-driven reporting: less data, faster detection
Sending everything all the time is both expensive and slow to act on. On a 5,000-terminal test platform covering acquisition, state-sensing, edge-computing and communication-access terminals, event-triggered uploading cut average anomaly discovery from 12.5 minutes under periodic polling to 7.2 minutes, a reduction of about 42%, while overall diagnostic accuracy reached 95.8% (Qin et al., 2026). The same work judged terminal liveness from process presence and heartbeat continuity, and resolved 42% of anomalies remotely and 30% through edge self-healing, so 72% closed without a site visit (Qin et al., 2026).
Wind-farm collector lines show the same pattern outdoors: tower nodes linked by LoRa over 3 to 5 km send one-minute statistics normally and full waveforms only when current moves beyond about 15% of rating, with 4G carrying aggregated data from the booster station to the cloud; a dynamic baseline cut false alarms from 18.6% to 3.1% in simulation (Shao, 2026). For anyone sizing data plans, the implication is clear: plan for a small steady baseline per terminal plus bursts around events, and confirm the burst behaviour with the terminal vendor.
| Terminal or node | Reporting design in the studies | Link options | Connectivity decision |
|---|---|---|---|
| Transformer-area concentrator | 5 s polling, event capture for partial discharge, 48 h cache (Tao, 2026) | 4G or LTE Cat-1 | Steady volume plus event bursts; per-area plan |
| Substation edge gateway | One upload per minute, 72 h autonomous local alarms (Liu, 2026) | Fibre primary, 5G backup | Backup SIM sized for outage periods |
| Feeder or cable sensing unit | Adjustable 1–60 min sampling, 3–5 years on battery (Cen, 2026) | LPWA (NB-IoT or LTE-M) | Low-volume pooled plan |
| Collector-line tower node | 1 min statistics, waveforms on events (Shao, 2026) | LoRa to a 4G gateway | SIM only at the aggregation point |
| Distribution automation terminal with eSIM | Utility-specific | 4G, 5G or RedCap | To be confirmed during project validation |
Watching the terminals, not only the grid
Equipment-condition analytics only work if the monitoring terminals are healthy. Hidden faults in low-voltage terminals were found by clustering six months of 5-minute data from 215 terminals and flagging time segments that did not fit any normal pattern (Chen & Shen, 2026). Heartbeat-based liveness and category-specific health scoring did the same job across thousands of terminals on the test platform (Qin et al., 2026). Connectivity data adds a second view: whether a SIM is attached, when its last data session ended and how much it sent. A connectivity management platform (CMP) that exposes these signals through an API lets operations teams tell a dead modem or an expired plan from a failed sensor before a technician dispatch, which is often the difference between a remote recovery and a wasted field visit. Our overview of how CMP platforms help manage IoT SIM deployments covers these functions.
Rolling out in phases
None of the studies started with a whole province. One plan begins with a single 10 kV line and 86 transformers for three months, extends to full urban coverage, and then rolls out low-power sensors to rural areas (Cen, 2026). Connectivity should follow the same staging. A pilot can run on a standard plan; the move to full coverage is where buyers should settle data pooling, backup paths, SIM format, eSIM profiles and lifecycle tools. If your terminals use eSIM for remote provisioning and multi-operator access, our guide to eSIM in distribution automation terminals covers module interfaces and authentication.
When to request a project quote
Catalog pricing is usually enough for a pilot line or a few concentrators on one network. Request a project quote when terminal counts reach thousands, when you need pooled data for event bursts, when backup cellular links must sit beside fibre, when terminals need multi-network failover or eSIM, when SIM status must feed your monitoring through a CMP or API, or when terminals will be installed in other countries where permanent roaming restrictions or local registration rules apply. Our quote process lists the details that make a quote accurate.
Risk boundaries
All six studies come from Chinese utilities or test platforms. Several results come from simulations or test beds rather than long field operation: the 5,000-terminal platform used injected faults (Qin et al., 2026), the collector-line work is simulation only (Shao, 2026), the transformer-area pilot covered three areas over 30 days (Tao, 2026), and the county-level system reports design targets (Cen, 2026). The figures are useful for planning but do not prove the same gains on another grid. Coverage at specific sites, operator authorization, failover behaviour and any service levels require project-specific confirmation; we do not offer an SLA unless one is agreed for a project.
How this maps to Quanqiu IoT
Quanqiu IoT supplies Global IoT SIM connectivity for grid terminals, concentrators and edge gateways, eSIM for terminals that need remote profile management, and CMP access so SIM status and usage can sit beside your equipment monitoring. For utility projects we start from the terminal categories, reporting design, backup requirements and rollout phases, then propose plans and SIM formats in a project quote.
FAQ
How much data does a transformer-area concentrator use?
It depends on polling and event capture. Published designs poll every few seconds and add event bursts, so size a steady baseline plus burst headroom and confirm the event behaviour with the vendor.
Do sensors keep working when the cellular link drops?
In the designs reviewed, concentrators cache 48 hours and substation gateways keep local alarms running for 72 hours, then resend data when the link returns.
Can a utility close faults without sending a crew?
On one 5,000-terminal test platform, 72% of anomalies were closed remotely or by edge self-healing. Field results depend on terminal design and how quickly a fault can be classified.
Should backup links use the same operator as the primary?
Ideally not. A cellular backup beside fibre, or multi-network SIMs where permitted, avoids a single point of failure; availability per site needs confirmation.
How do we tell a failed modem from a failed sensor?
Combine terminal heartbeats with SIM-level data from a CMP: attach status, last session and usage. That separates connectivity faults from device faults before dispatch.
Official References
- European Commission — Smart grids and meters
- DLMS User Association — DLMS/COSEM
- GSMA — IoT RSP: Enabling the growth of Massive IoT
- Cen Jingling (2026). A New System for Operation and Maintenance Monitoring of Power Distribution Facilities under an IoT Architecture (in Chinese). 电子科技, 136-138. DOI: 10.3969/j.issn.1006-6675.2026.18.46
- Chen Jiayin, Shen Jingwei (2026). Research on Automatic Anomaly Detection of Distribution Equipment Based on Internet of Things Technology (in Chinese). 工业控制计算机, 39(9), 129-130.
- Liu Jianhua (2026). Analysis of Digital Operation and Maintenance System for Power Equipment Based on Internet of Things and Big Data (in Chinese). 油气田地面工程.
- Tao Zhongyun (2026). Research on Application of Internet of Things Technology in Operation and Maintenance Management of Intelligent Distribution Transformer Areas (in Chinese). 智能物联技术.
- Qin Qiang, Yang Yongjiao, Shao Yaning, Lin Jiaxin, Huang Hanye (2026). Research on Remote Management and Intelligent Diagnosis Technology for Large-scale Power IoT Terminals (in Chinese). 电信科学. DOI: 10.11959/j.issn.1000-0801.DXKX260290
- Shao Rong (2026). Study on the Optimisation of Operation and Maintenance for 66 kV Wind Power Collection Lines Based on an Internet of Things Architecture (in Chinese). 智能物联技术.